Multiple Choice
The accompanying figure shows the graph of y = x2 shifted to a new position. Write the equation for the new graph. 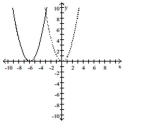
A)
B)
C)
D)
Correct Answer:

Verified
Correct Answer:
Verified
Related Questions
Q45: Graph the function. Specify the intervals
Q46: The accompanying figure shows the graph
Q47: Find a formula for the function
Q48: The accompanying figure shows the graph
Q49: Graph the function. Specify the intervals
Q51: Find the domain and range for
Q52: Graph the function.<br>- <span class="ql-formula" data-value="G
Q53: Provide an appropriate response.<br>-What real numbers
Q54: Determine whether or not the graph is
Q55: Find the formula for the function.<br>-Express