Multiple Choice
\text { Find the value of \& #61537; as shown in the figure below. } 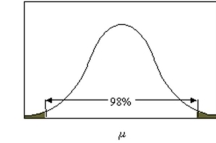
A) 0.01
B) 0.02
C) 0.04
D) 0.05
Correct Answer:

Verified
Correct Answer:
Verified
Related Questions
Q1: The symbol for the sample proportion is
Q1: The width of a confidence interval for
Q3: A report states that 40% of home
Q4: Find the 95% confidence interval for
Q5: A quality control expert wants to estimate
Q7: A survey of 800 women shoppers found
Q8: A college believes that 28% of applicants
Q9: A sample of 1,108 was used to
Q11: If a population has standard deviation 18,
Q30: The are the number of values that