Essay
For the following data, construct a graph showing the probability distribution.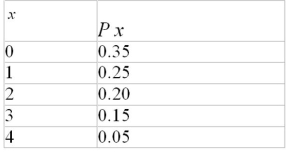
Correct Answer:

Verified
Correct Answer:
Verified
Related Questions
Q10: A pet supplier has a stock of
Q11: If the standard deviation of a probability
Q12: Find the mean of the distribution shown.<br><img
Q13: In a multinomial distribution, events must be
Q14: If there are 20 typographical errors
Q16: The number of cartoons watched by Mrs.
Q17: On a Saturday evening, 34% of the
Q18: <span class="ql-formula" data-value="\begin{array}{l}\text { Find the mean
Q19: A computer store has 50 printers of
Q20: The probability that a person will have