Multiple Choice
Use the following frequency table to determine the proportion of values less than 60. 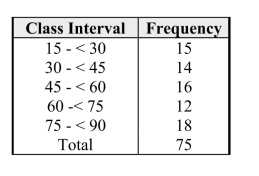
A) 0.187
B) 0.200
C) 0.213
D) 0.240
E) 0.600
Correct Answer:

Verified
Correct Answer:
Verified
Q95: A test statistic for testing the utility
Q96: <img src="https://d2lvgg3v3hfg70.cloudfront.net/TB8803/.jpg" alt=" " class="answers-bank-image d-block" rel="preload"
Q97: Suppose that a frequency distribution and a
Q98: <img src="https://d2lvgg3v3hfg70.cloudfront.net/TB8803/.jpg" alt=" " class="answers-bank-image d-block" rel="preload"
Q99: In a study of male / female
Q101: Suppose that in a certain part of
Q102: Use the following information for questions <img
Q103: <img src="https://d2lvgg3v3hfg70.cloudfront.net/TB8803/.jpg" alt=" " class="answers-bank-image d-block" rel="preload"
Q104: Two variables are confounded if<br>A)their effects on
Q105: Which of the following statements about normal