Not Answered
 The scatterplot below is from an analysis of the number species of fish present and the acidity (pH)of 15 randomly selected rivers in New England.
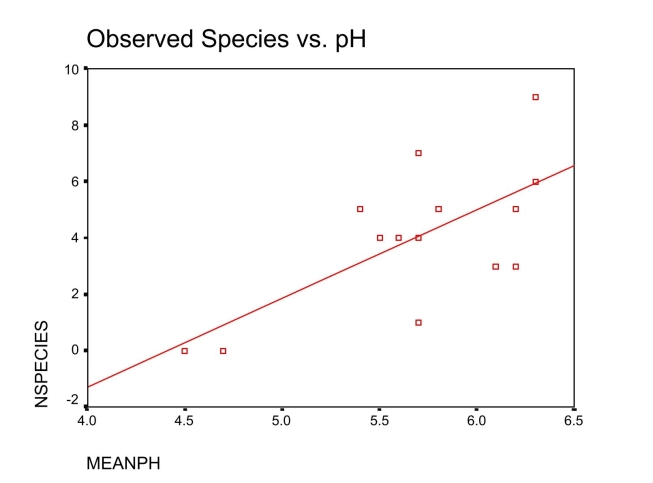
Correct Answer:

Verified
Correct Answer:
Verified
Related Questions
Q23: The percentage of data points falling at
Q24: Use the following information for questions <br>One
Q25: Use the following information for questions <img
Q26: The test statistic for the t test
Q27: A 95% confidence interval for the mean
Q29: Which of the following variables yields data
Q30: A study cannot be an experiment if<br>A)only
Q31: One of the t-procedures for making inferences
Q32: Which of the following are true statements:
Q33: A type I error is made by