Essay
A statewide survey released by the University of Iowa Injury Prevention Research Center was designed to assess compliance with Iowa seatbelt law.The table at right shows the results for 5 Iowa cities. compared for the different cities. 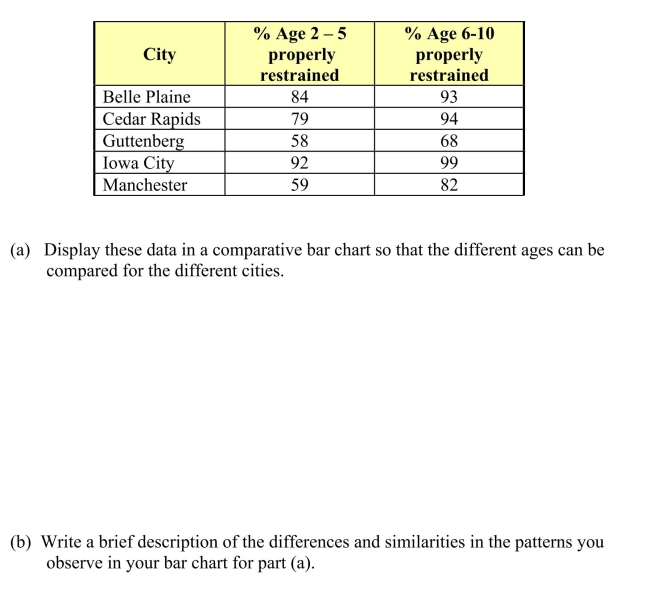 observe in your bar chart for part (a).
Correct Answer:

Verified
 rates th...
View Answer
Unlock this answer now
Get Access to more Verified Answers free of charge
Correct Answer:
Verified
View Answer
Unlock this answer now
Get Access to more Verified Answers free of charge
Q8: One advantage of histograms is that they
Q10: If the upper tail of a distribution
Q12: <img src="https://d2lvgg3v3hfg70.cloudfront.net/TB8803/.jpg" alt=" " class="answers-bank-image d-block" rel="preload"
Q13: Iowa is an agricultural state with a
Q15: For stem and leaf plots with single-digit
Q16: Ruminants are hoofed animals such as cattle
Q16: A pie chart is most useful for
Q19: The density of a class can be
Q20: A curve with tails that decline more
Q24: In a scatter plot, both the horizontal