Essay
The graphs below are normal probability plots of the vocabulary and math concept
scores on a standardized exam for a large sample of students. One of the score
distributions is approximately normal. Identify the score distribution that is
approximately normal and explain the reason for your choice. 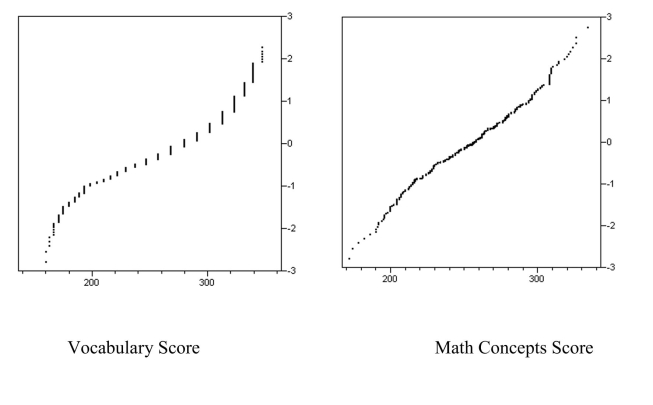
Correct Answer:

Verified
The Math Concepts Score is app...View Answer
Unlock this answer now
Get Access to more Verified Answers free of charge
Correct Answer:
Verified
View Answer
Unlock this answer now
Get Access to more Verified Answers free of charge
Q12: A random variable is continuous if its
Q19: The time that it takes a randomly
Q22: The distribution of all values of a
Q35: <span class="ql-formula" data-value="\text { For a discrete
Q36: When driving the nation's highways, Anna
Q37: Inspecting meat is a very important part
Q38: In a study performed by the statistics
Q39: Using the notation C = continuous and
Q44: For a variable that has a
Q45: The probability of <span class="ql-formula"