Essay
The Des Moines Register article in problem also related the percent of children eligible for Free and Reduced lunch to teacher experience. The percent of children eligible for Free/Reduced lunch is an indicator of the socio economic status of a neighborhood. The Register was concerned that less experienced teachers typically teach students from low income families. The accompanying scatter plot displays the data from the article.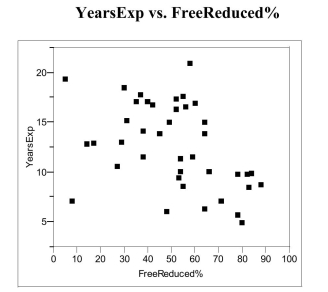
(a) If lesser experienced teachers typical ly teach students from low-income families,
what sort of trend or pattern should appear in the scatter plot?
(b) Does this trend or pattern emerge in these data? Explain, referring to specific
aspects of the scatterplot.
Correct Answer:

Verified
a) If the newspaper is correct, then sch...View Answer
Unlock this answer now
Get Access to more Verified Answers free of charge
Correct Answer:
Verified
View Answer
Unlock this answer now
Get Access to more Verified Answers free of charge
Q6: An outlier is a data value that
Q14: A segmented bar chart uses rectangles rather
Q15: Artificial bird nests have been used
Q16: A pie chart is most useful for
Q17: During the first six months of the
Q18: The stem-and-leaf plot below displays the
Q19: It is well known that the
Q23: One of the "media messages" sent
Q24: A time series plot is a graph
Q28: When using histograms to compare groups of