Essay
As part of the United States Census, data is collected on the number of persons in each
household. The census data for four decades are summarized below.
(a) In a few sentences describe how the (Percent distribution) proportion of households with 4 people has changed from 1970 to
Source: U.S. Census Bureau, Current Population Survey, March Supplements: 1970 to 2000 .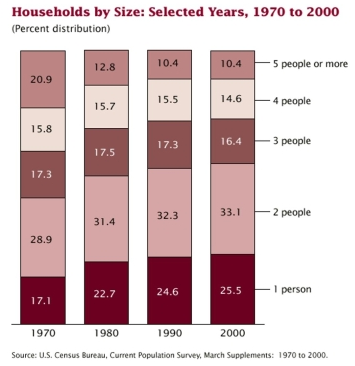 (b) What size of household appears to have decreased the most from 1970 to 2000?
Correct Answer:

Verified
a) The proportion of households with 4 p...View Answer
Unlock this answer now
Get Access to more Verified Answers free of charge
Correct Answer:
Verified
View Answer
Unlock this answer now
Get Access to more Verified Answers free of charge
Q8: During the first six months of the
Q9: Hoofed animals such as cattle and
Q10: Investigators were interested in communication about sex
Q11: The average circumferences (distances around) in mm
Q14: A study by the National Bureau
Q15: Artificial bird nests have been used
Q16: A pie chart is most useful for
Q17: During the first six months of the
Q18: The stem-and-leaf plot below displays the
Q29: A bar chart is a graphical display