Essay
A very large study of college students' study habits found that the time (in hours) that
freshmen study each week is approximately normal with mean 24 hours and standard
deviation 8 hours. Consider random samples of size 16 from the population of freshmen. a) On the axes below, sketch curves representing the distribution of the original population and the sampling distribution of for samples of size . Be sure to indicate which curve is which. What are the mean and standard deviation of the sampling distribution of ?
b) What is the probability that a sample of size from this population would result in a sample mean greater than 30 hours? The study of college freshmen also asked about the students' time spent playing video games. Suppose that the population relative frequency histogram for time spend playing video games is as shown below. The mean amount of time spent playing video games was hours per week.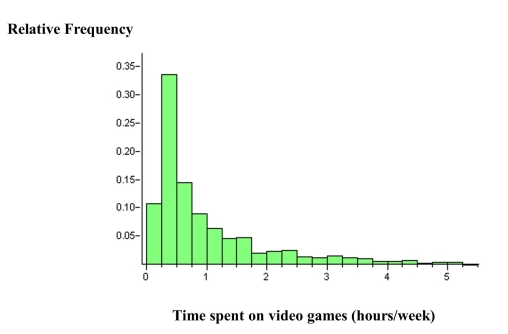
c) Suppose you were to take a random sample, , from this population of freshmen and ask them how much time they spent playing video games per week. Describe the shape, center, and spread of the sampling distribution of , as compared to the population distribution.
Correct Answer:

Verified
a)

b)
\[\begin{array} { l }
z = \frac ...View Answer
Unlock this answer now
Get Access to more Verified Answers free of charge
Correct Answer:
Verified
b)
\[\begin{array} { l }
z = \frac ...
View Answer
Unlock this answer now
Get Access to more Verified Answers free of charge
Q2: In a few sentences, describe the difference
Q12: A A random sample of size
Q13: Give as much information as you
Q15: Give as much information as you
Q16: When the hatching of young geese
Q18: Many national parks, wildlife refuges, and
Q20: <span class="ql-formula" data-value="\text { The standard error
Q21: When performing hypothesis tests, there are assumptions
Q22: As <span class="ql-formula" data-value="n"><span class="katex"><span
Q26: The level of significance of a test