Multiple Choice
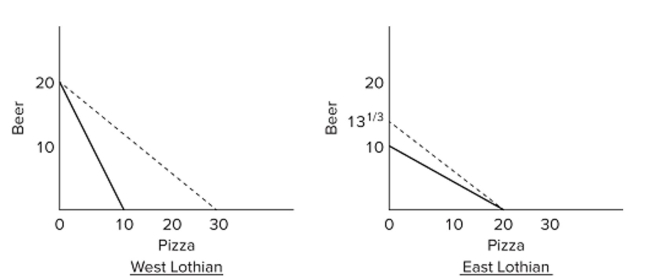 In the accompanying diagrams, solid lines are production possibilities curves, and the dashed lines are trading possibilities curves. The trading possibilities curves suggest that the terms of trade are
A) 1.5 beers for 1 pizza.
B) 1 beer for 2 pizzas.
C) 2 beers for 1 pizza.
D) 1 beer for 1.5 pizzas.
Correct Answer:

Verified
Correct Answer:
Verified
Q9: A nation's export supply curve for a
Q10: Describe the economic reasons why businesses use
Q11: A tariff is a<br>A) tax.<br>B) price ceiling.<br>C)
Q12: A tariff can best be described as<br>A)
Q13: Assume that by devoting all its resources
Q15: A nation's export supply curve is downsloping,
Q16: <img src="https://d2lvgg3v3hfg70.cloudfront.net/TB8601/.jpg" alt=" Suppose the world
Q17: The ratio at which nations will exchange
Q18: Assume that by devoting all its resources
Q19: <span class="ql-formula" data-value="\begin{array} { | c |