Multiple Choice
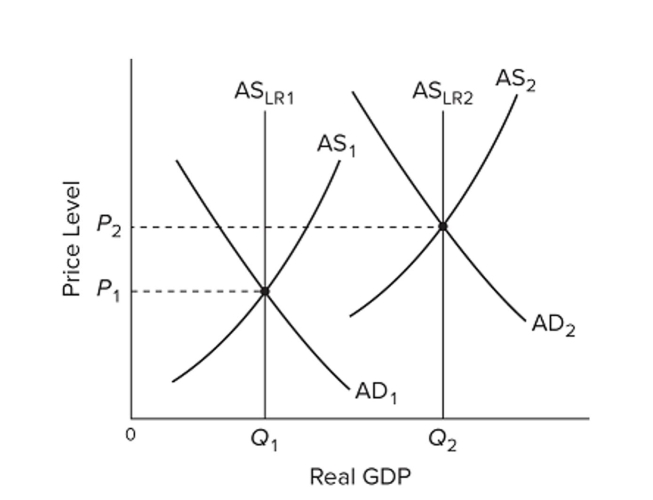 Refer to the graphs, where the subscripts on the labels denote years 1 and 2. From the graphs we can conclude that from year 1 to year 2,
A) the economy recovered from a recession.
B) the economy experienced economic growth and inflation.
C) output grew and the unemployment rate fell.
D) the government engaged in expansionary fiscal and monetary policies.
Correct Answer:

Verified
Correct Answer:
Verified
Q150: <img src="https://d2lvgg3v3hfg70.cloudfront.net/TB8601/.jpg" alt=" Refer
Q151: A basic criticism of supply-side economics is
Q152: An adverse aggregate supply shock<br>A) automatically shifts
Q153: If the expected rate of inflation rises,
Q154: <img src="https://d2lvgg3v3hfg70.cloudfront.net/TB34225555/.jpg" alt=" Refer
Q156: The level of potential output and location
Q157: <img src="https://d2lvgg3v3hfg70.cloudfront.net/TB8601/.jpg" alt=" Refer to the
Q158: <img src="https://d2lvgg3v3hfg70.cloudfront.net/TB8601/.jpg" alt=" Suppose the full
Q159: <img src="https://d2lvgg3v3hfg70.cloudfront.net/TB8601/.jpg" alt=" Refer to the
Q160: Which action will tend to decrease aggregate