Multiple Choice
 Refer to the diagram for a specific economy. The curve on this graph is known as a
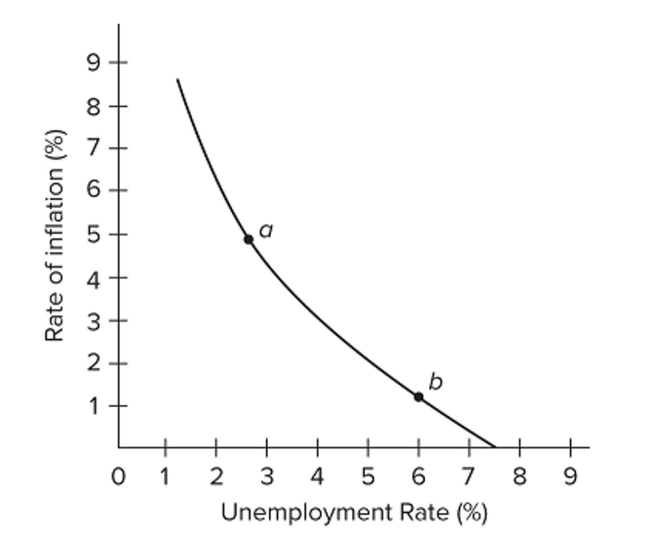
A) Laffer Curve.
B) Phillips Curve.
C) labor demand curve.
D) production possibilities curve.
Correct Answer:

Verified
Correct Answer:
Verified
Q195: The Romer and Romer paper, "The Macroeconomic
Q196: <img src="https://d2lvgg3v3hfg70.cloudfront.net/TB34225555/.jpg" alt=" Refer
Q197: <img src="https://d2lvgg3v3hfg70.cloudfront.net/TB8601/.jpg" alt=" Refer
Q198: <img src="https://d2lvgg3v3hfg70.cloudfront.net/TB8601/.jpg" alt=" Refer to the
Q199: Consider the following national data: tax revenues
Q201: <img src="https://d2lvgg3v3hfg70.cloudfront.net/TB8601/.jpg" alt=" Refer to the
Q202: Stagflation refers to<br>A) an increase in inflation
Q203: <img src="https://d2lvgg3v3hfg70.cloudfront.net/TB8601/.jpg" alt=" Suppose the full
Q204: In terms of aggregate supply, a period
Q205: In terms of aggregate supply, the short