Multiple Choice
 The diagram is the basis for explaining
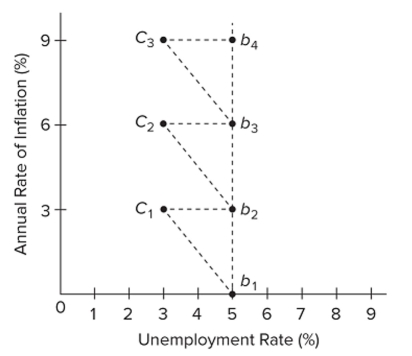
A) the traditional Phillips Curve.
B) the long-run Phillips Curve.
C) how central planning can make full employment and price level stability compatible goals.
D) new policies for eliminating unemployment.
Correct Answer:

Verified
Correct Answer:
Verified
Q158: <img src="https://d2lvgg3v3hfg70.cloudfront.net/TB8601/.jpg" alt=" Suppose the full
Q159: <img src="https://d2lvgg3v3hfg70.cloudfront.net/TB8601/.jpg" alt=" Refer to the
Q160: Which action will tend to decrease aggregate
Q161: The long-run aggregate supply curve stays in
Q162: Adverse aggregate supply shocks would result in<br>A)
Q164: A rightward shift of the traditional Phillips
Q165: The last few years of the 1990s
Q166: What is the Phillips curve? What concept
Q167: The short-run aggregate supply curve intersects the
Q168: Evaluate the Laffer curve from today's perspective.