Multiple Choice
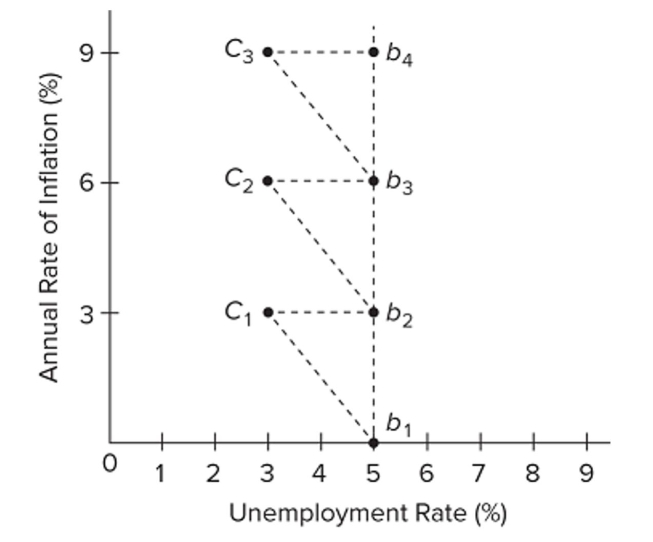 Refer to the diagram and assume the economy is initially at point b1. The long-run relationship between the unemployment rate and the rate of in?ation is represented by
A) the line connecting
B) the line through
C) the line connecting
D) any line parallel to the horizontal axis.
Correct Answer:

Verified
Correct Answer:
Verified
Q110: What is the misery index? Why do
Q111: (Last Word) According to the research of
Q112: <img src="https://d2lvgg3v3hfg70.cloudfront.net/TB8601/.jpg" alt=" Refer
Q113: If cost-push inflation occurs and the government
Q114: The traditional Phillips Curve suggests that, if
Q116: The basic problem portrayed by the traditional
Q117: A shift in the Phillips Curve to
Q118: Explain the basic arguments for supply-side economics.
Q119: The inflation and unemployment data for the
Q120: <img src="https://d2lvgg3v3hfg70.cloudfront.net/TB8601/.jpg" alt=" Refer to the