Multiple Choice
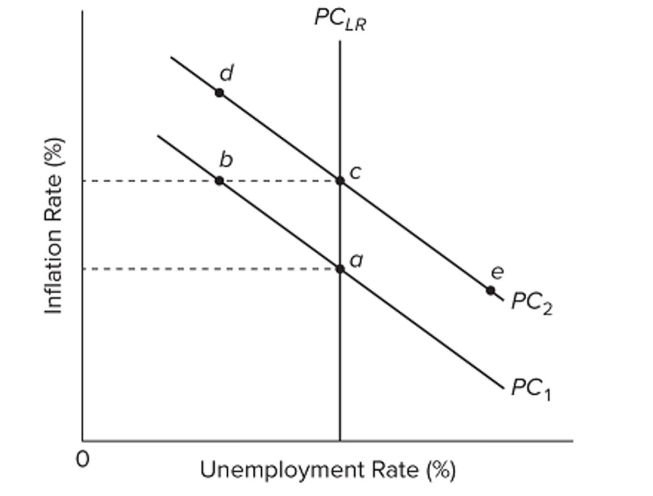 Refer to the diagram. Point b would be explained by
A) an actual rate of inflation that exceeds the expected rate.
B) an actual rate of inflation that is less than the expected rate.
C) cost-push inflation.
D) an increase in long-run aggregate supply.
Correct Answer:

Verified
Correct Answer:
Verified
Q30: <img src="https://d2lvgg3v3hfg70.cloudfront.net/TB8601/.jpg" alt=" A)
Q31: In the long run, the economy will
Q32: In the long run, demand-pull inflation leads
Q33: In the extended aggregate demand-aggregate supply model,<br>A)
Q34: In the short run, demand-pull inflation will
Q36: <img src="https://d2lvgg3v3hfg70.cloudfront.net/TB34225555/.jpg" alt=" Refer
Q37: Supply-side economist Arthur Laffer has argued that<br>A)
Q38: <img src="https://d2lvgg3v3hfg70.cloudfront.net/TB8601/.jpg" alt=" Refer
Q39: The short run in macroeconomics is a
Q40: In terms of aggregate supply, the difference