Multiple Choice
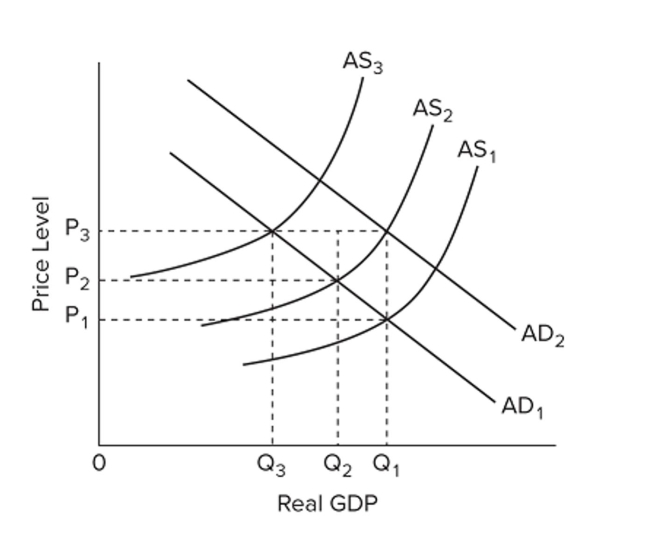
 Refer to the graph. Suppose that the economy is at an initial equilibrium where the AD curves intersect. Demand-pull in?ation in the long run can best be illustrated as a shift of
A)
B)
C)
D)
Correct Answer:

Verified
Correct Answer:
Verified
Q83: Rightward and upward shifts of the Phillips
Q84: <img src="https://d2lvgg3v3hfg70.cloudfront.net/TB8601/.jpg" alt=" Refer to the
Q85: The traditional Phillips Curve shows the<br>A) direct
Q86: In the long run, if the price
Q87: <img src="https://d2lvgg3v3hfg70.cloudfront.net/TB8601/.jpg" alt=" Refer
Q89: <img src="https://d2lvgg3v3hfg70.cloudfront.net/TB8601/.jpg" alt=" A) decrease tax
Q90: In terms of aggregate supply, a period
Q91: According to the simple extended AD-AS model,
Q92: (Last Word) Do tax increases reduce real
Q93: Statistical data for the 1970s and 1980s