Multiple Choice
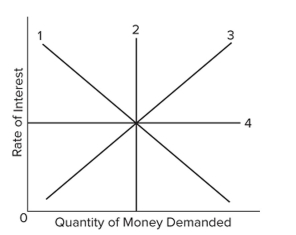 Which line in the graph would best illustrate the asset demand for money curve?
A) Line 1
B) Line 2
C) Line 3
D) Line 4
Correct Answer:

Verified
Correct Answer:
Verified
Related Questions
Q370: In terms of the mechanics of quantitative
Q371: The level of GDP, ceteris paribus, will
Q372: Why wouldn't the Fed want to drive
Q373: A bond with no expiration has an
Q374: Since the 2008 financial crisis, borrowing at
Q376: <span class="ql-formula" data-value="\begin{array} { | c |
Q377: If nominal GDP is $800 billion and,
Q378: Which of the following best describes the
Q379: The Fed increases interest rates mainly by
Q380: <img src="https://d2lvgg3v3hfg70.cloudfront.net/TB8601/.jpg" alt=" A)