Multiple Choice
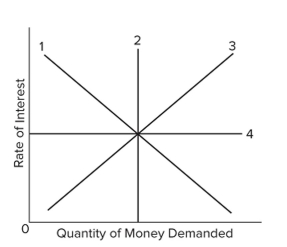 Which line in the graph would best illustrate the supply of money curve?
A) Line 4
B) Line 3
C) Line 2
D) Line 1
Correct Answer:

Verified
Correct Answer:
Verified
Related Questions
Q339: Before the financial crisis of 2008, if
Q340: When the Fed raises the interest rate
Q341: Which of the following is a monetary
Q342: <img src="https://d2lvgg3v3hfg70.cloudfront.net/TB8601/.jpg" alt=" Refer to the
Q343: The job of the Fed in limiting
Q345: If the economy were encountering a severe
Q346: The federal funds rate is the rate
Q347: Projecting that it might temporarily fall short
Q348: The federal funds rate is the interest
Q349: In 2008, the Fed acquired a fourth