Multiple Choice
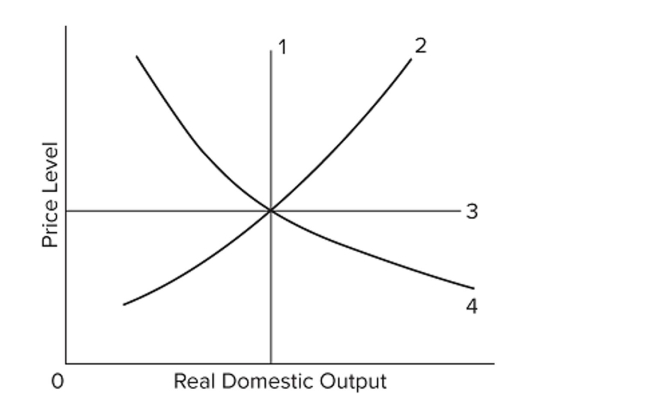 In the diagram, the economy's relevant aggregate demand and long-run aggregate supply curves, are lines
A) 4 and 2, respectively.
B) 4 and 1, respectively.
C) 2 and 4, respectively.
D) 2 and 3, respectively.
Correct Answer:

Verified
Correct Answer:
Verified
Q26: If productivity increases, then the per-unit production
Q27: When the economy is experiencing demand-pull inflation,
Q28: When aggregate demand declines, wage rates may
Q29: <img src="https://d2lvgg3v3hfg70.cloudfront.net/TB8601/.jpg" alt=" A) an increase
Q30: <img src="https://d2lvgg3v3hfg70.cloudfront.net/TB8601/.jpg" alt=" A) decrease in
Q32: If the dollar depreciates in value relative
Q33: <img src="https://d2lvgg3v3hfg70.cloudfront.net/TB8601/.jpg" alt=" A)
Q34: <img src="https://d2lvgg3v3hfg70.cloudfront.net/TB8601/.jpg" alt=" A) the aggregate
Q35: <img src="https://d2lvgg3v3hfg70.cloudfront.net/TB8601/.jpg" alt=" A) decrease in
Q36: The aggregate supply curve (short run) becomes