Multiple Choice
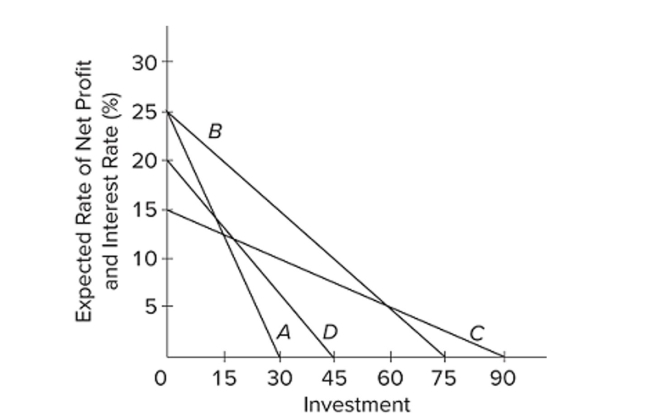 Refer to the diagram. Assume that for the entire business sector of a private closed economy there is $0 worth of investment projects that will yield an expected rate of return of 25 percent or more. But
There are $15 worth of investments that will yield an expected rate of return of 20-25 percent; another
$15 with an expected rate of return of 15-20 percent; and an additional $15 of investment projects in
Each successive rate of return range down to and including the 0-5 percent range. Which of the lines
On the diagram represents these data?
A) A
B) B
C) C
D) D
Correct Answer:

Verified
Correct Answer:
Verified
Q94: <img src="https://d2lvgg3v3hfg70.cloudfront.net/TB8601/.jpg" alt=" Refer to the
Q95: A decline in the real interest rate
Q96: Other things equal, a decrease in the
Q97: Other things equal, a 10 percent decrease
Q98: If the consumption schedule is linear, then
Q100: The consumption schedule is such that<br>A) both
Q101: <img src="https://d2lvgg3v3hfg70.cloudfront.net/TB8601/.jpg" alt=" Refer to the
Q102: <img src="https://d2lvgg3v3hfg70.cloudfront.net/TB8601/.jpg" alt=" Suppose an economy's
Q103: If a $200 billion increase in investment
Q104: <span class="ql-formula" data-value="\begin{array} { | l |