Multiple Choice
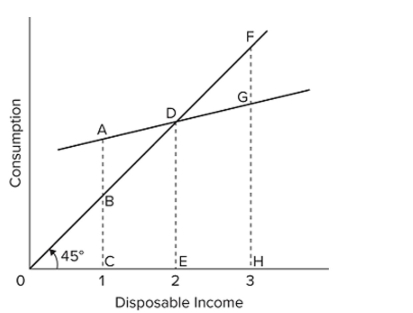 Refer to the consumption schedule shown in the graph. At income level 1, the amount of saving is
A) positive.
B) negative.
C) zero.
D) not measurable.
Correct Answer:

Verified
Correct Answer:
Verified
Related Questions
Q178: Assume that an increase in a household's
Q179: The fraction, or percentage, of total income
Q180: <img src="https://d2lvgg3v3hfg70.cloudfront.net/TB8601/.jpg" alt=" Refer to the
Q181: If the consumption schedule is a straight
Q182: Personal saving is equal to<br>A) disposable income
Q184: If a $50 billion decrease in investment
Q185: The size of the multiplier is equal
Q186: The investment demand curve portrays an inverse
Q187: If consumption increases while income remains the
Q188: The multiplier is equal to the reciprocal