Multiple Choice
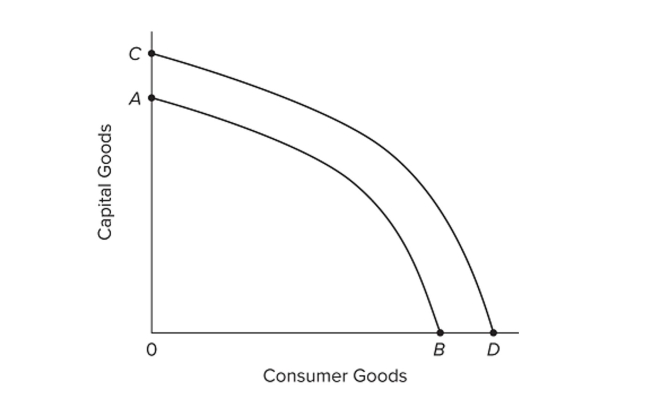 Refer to the graph. Growth of production capacity is shown by the
A) shift from AB to CD.
B) shift from CD to AB.
C) movement away from point A and toward point B.
D) movement away from point B and toward point A.
Correct Answer:

Verified
Correct Answer:
Verified
Related Questions
Q143: If an economy has 800,000 hours of
Q144: Which of the following best measures improvements
Q145: How does investment in capital goods and
Q146: Real GDP per capita<br>A) cannot grow more
Q147: Real GDP per capita is found by
Q149: Increases in household and business spending are
Q150: Define worker-hours and labor productivity.
Q151: Real per capita GDP<br>A) grows at approximately
Q152: About what percentage of the growth in
Q153: Which of the following is a demand