Multiple Choice
 Refer to the accompanying diagram. Which of the following is the most likely cause for a shift in the production possibilities curve from AB to CD?
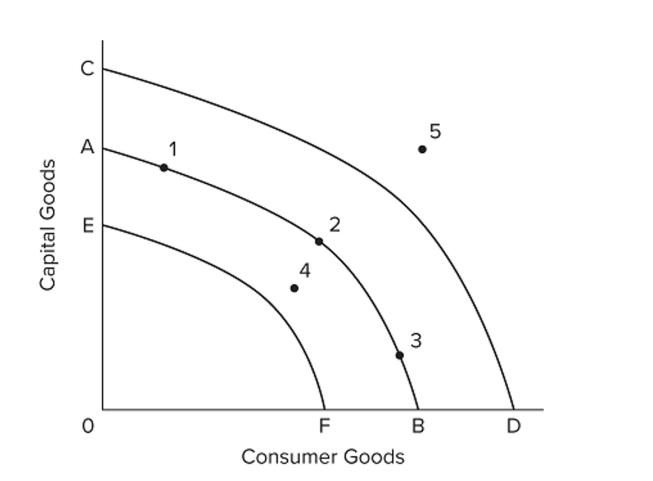
A) the use of the economy's resources in a more efficient way
B) an increase in the spending of business and consumers
C) an increase in government purchases of the economy's output
D) an increase in the quantity and quality of labor resources
Correct Answer:

Verified
Correct Answer:
Verified
Q264: In the growth debate, critics of economic
Q265: If real GDP grows at an average
Q266: Under what circumstances do rates of economic
Q267: Offer a defense of economic growth.
Q268: An increase in total spending generates economic
Q269: Which of the following factors has been
Q271: (Last Word) Explain the trend of the
Q272: Suppose total output (real GDP) is $4,000
Q273: Free trade<br>A) discourages growth by increasing competitive
Q274: Which of the following will not increase