Multiple Choice
 Refer to the diagram. Which of the following areas best represents the efficiency loss from underproduction?
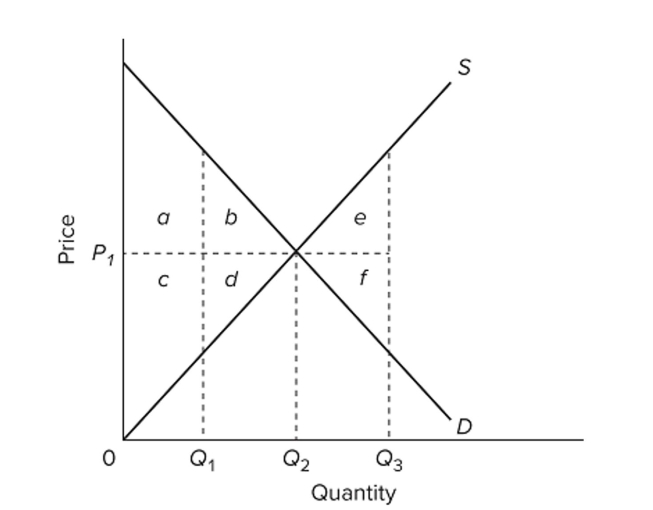
A) a + c
B) e + f
C) a + b + c + d
D) b + d
Correct Answer:

Verified
Correct Answer:
Verified
Q80: When critics of unemployment insurance claim that
Q81: Allocative efficiency occurs where the collective sum
Q82: <img src="https://d2lvgg3v3hfg70.cloudfront.net/TB8601/.jpg" alt=" In the provided
Q83: Along a supply curve, product price and
Q84: The Coase theorem suggests that the government
Q86: <img src="https://d2lvgg3v3hfg70.cloudfront.net/TB8601/.jpg" alt=" Refer to the
Q87: Define the term consumer surplus.
Q88: Suppose that the Anytown city government asks
Q89: In response to the 2008 financial crisis,
Q90: <img src="https://d2lvgg3v3hfg70.cloudfront.net/TB8601/.jpg" alt=" The MB curves