Multiple Choice
 Refer to the diagrams for two separate product markets. Assume that society's optimal level of output in each market is Q0 and that government purposely shifts the market supply curve from S to
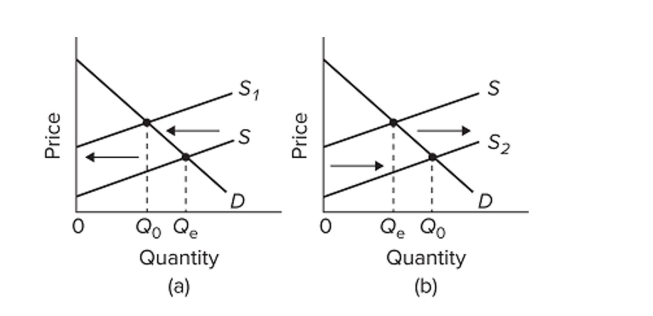
S1 in diagram (a) on the left and from S to S2 in diagram (b) on the right. We can conclude that the
Government is correcting for
A) negative externalities in diagram (a) and positive externalities in diagram (b) .
B) positive externalities in diagram (a) and negative externalities in diagram (b) .
C) negative externalities in both diagrams.
D) positive externalities in both diagrams.
Correct Answer:

Verified
Correct Answer:
Verified
Q1: Producer surplus is the difference between<br>A) the
Q2: The franchising of fast-food restaurants would be
Q4: <img src="https://d2lvgg3v3hfg70.cloudfront.net/TB8601/.jpg" alt=" Refer to the
Q5: (Last Word) The government should choose pollution
Q6: <img src="https://d2lvgg3v3hfg70.cloudfront.net/TB8601/.jpg" alt=" Refer to the
Q7: Define the term producer surplus.
Q8: <img src="https://d2lvgg3v3hfg70.cloudfront.net/TB8601/.jpg" alt=" Refer to the
Q9: (Consider This) There are no external costs
Q10: <img src="https://d2lvgg3v3hfg70.cloudfront.net/TB8601/.jpg" alt=" Refer to the
Q11: It is the custom for paper mills