Multiple Choice
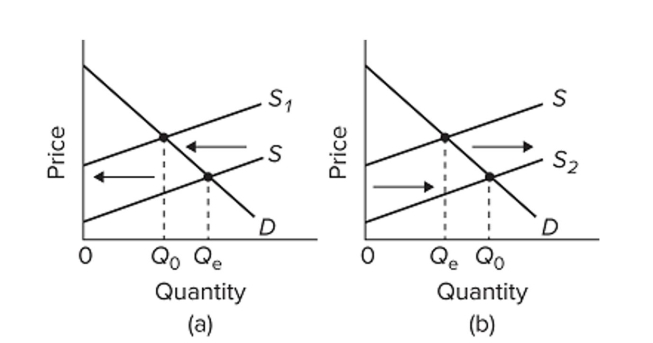 Refer to the diagrams for two separate product markets. Assume that society's optimal level of output in each market is Q0 and that government purposely shifts the market supply curve from S to
S1 in diagram (a) on the left and from S to S2 in diagram (b) on the right. The shift of the supply curve
From S to S2 in diagram (b) might be caused by a per-unit
A) subsidy paid to the producers of this product.
B) tax on the producers of this product.
C) subsidy paid to the buyers of this product.
D) tax on the buyers of this product.
Correct Answer:

Verified
Correct Answer:
Verified
Q144: When sellers are unable to distinguish "good"
Q145: Asymmetric information occurs when the two parties
Q146: Charlie is willing to pay $10 for
Q147: A significant amount of positive consumer surplus
Q148: Buyers will opt out of markets in
Q150: Market failures<br>A) are only a concern when
Q151: The value that consumers get (from consuming
Q152: TripAdvisor provides online reviews of hotels, restaurants,
Q153: If car makers are required to install
Q154: <img src="https://d2lvgg3v3hfg70.cloudfront.net/TB8601/.jpg" alt=" Refer to the