Multiple Choice
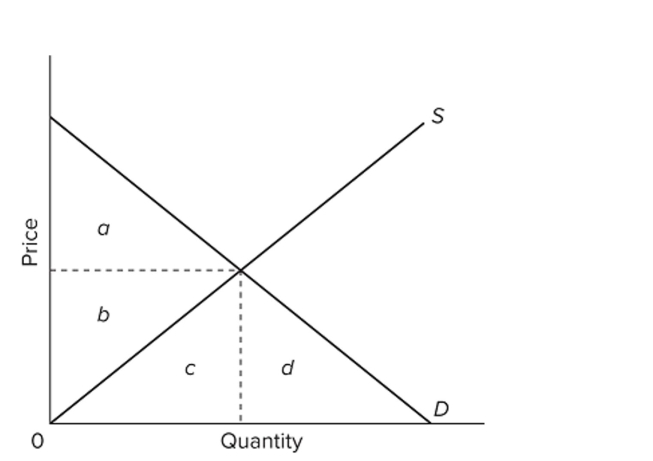 In the provided graph, the equilibrium point in the market is where the S and D curves intersect. At equilibrium, the total revenues received by sellers would be represented by the area
A) b.
B) b + c.
C) a + b.
D) b + c + d.
Correct Answer:

Verified
Correct Answer:
Verified
Q8: <img src="https://d2lvgg3v3hfg70.cloudfront.net/TB8601/.jpg" alt=" Refer to the
Q9: (Consider This) There are no external costs
Q10: <img src="https://d2lvgg3v3hfg70.cloudfront.net/TB8601/.jpg" alt=" Refer to the
Q11: It is the custom for paper mills
Q12: Allocative efficiency occurs only at that output
Q14: The marginal cost to society of reducing
Q15: <img src="https://d2lvgg3v3hfg70.cloudfront.net/TB8601/.jpg" alt=" Refer to the
Q16: Graphically, producer surplus is measured as the
Q17: <img src="https://d2lvgg3v3hfg70.cloudfront.net/TB8601/.jpg" alt=" In the provided
Q18: If a person drives with less care