Multiple Choice
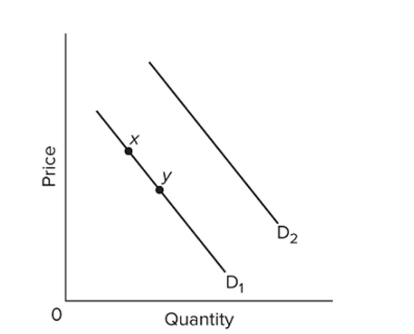 Refer to the diagram. A decrease in demand is depicted by a
A) move from point x to point y.
B) shift from D1 to D2.
C) shift from D2 to D1.
D) move from point y to point x.
Correct Answer:

Verified
Correct Answer:
Verified
Related Questions
Q10: A fall in the price of milk,
Q11: <span class="ql-formula" data-value="\begin{array} { | c |
Q12: If there is a shortage of product
Q13: If products A and B are complements
Q14: A market for a product reaches equilibrium
Q16: If the demand and supply curves for
Q17: Other things equal, if the price of
Q18: In the following question you are asked
Q19: An increase in demand coupled with a
Q20: <img src="https://d2lvgg3v3hfg70.cloudfront.net/TB8601/.jpg" alt=" Refer to the