Multiple Choice
 Refer to the diagram. An increase in quantity supplied is depicted by a
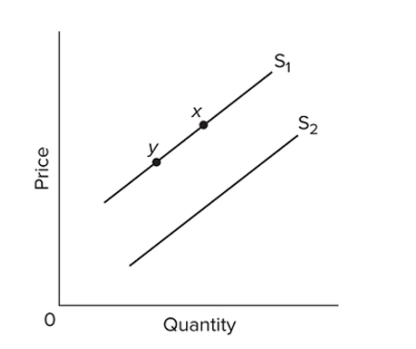
A) move from point y to point x.
B) shift from S1 to S2.
C) shift from S2 to S1.
D) move from point x to point y.
Correct Answer:

Verified
Correct Answer:
Verified
Related Questions
Q237: <img src="https://d2lvgg3v3hfg70.cloudfront.net/TB8601/.jpg" alt=" Refer to the
Q238: Attaining "allocative efficiency" means that<br>A) the law
Q239: In the following question you are asked
Q240: With a downsloping demand curve and an
Q241: There is a surplus of tomatoes in
Q243: Assume the demand curve for product X
Q244: In 2018, the price of oil increased,
Q245: In the following question you are asked
Q246: <span class="ql-formula" data-value="\begin{array} { | c |
Q247: Suppose that a more efficient way to