Multiple Choice
(Advanced analysis) The equation for the supply curve in the diagram shown is approximately 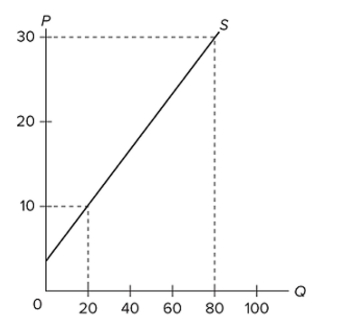
A) P = 4 + 0.3Q.
B) P = 4 + 2Q.
C) P = 4 + 0.5Q.
D) P = 4 - 3Q.
Correct Answer:

Verified
Correct Answer:
Verified
Related Questions
Q36: All of the following would affect the
Q37: A government-set price floor on a product<br>A)
Q38: An increase in demand accompanied by an
Q39: The demand curve shows the relationship between<br>A)
Q40: <span class="ql-formula" data-value="\begin{array} { | c |
Q42: If a price ceiling is set below
Q43: Allocative efficiency is concerned with<br>A) producing the
Q44: <img src="https://d2lvgg3v3hfg70.cloudfront.net/TB8601/.jpg" alt=" Refer to the
Q45: The figure below shows three demand curves
Q46: (Advanced analysis) The demand for commodity X