Multiple Choice
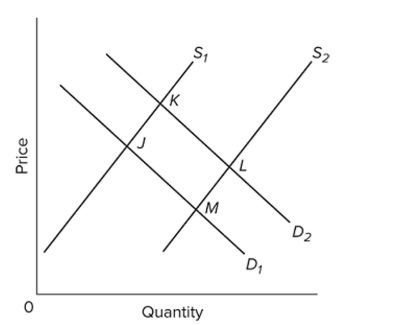 Refer to the diagram, in which S1 and D1 represent the original supply and demand curves and S2 and D2 the new curves. In this market
A) the equilibrium position has shifted from M to K.
B) an increase in demand has been more than offset by an increase in supply.
C) the new equilibrium price and quantity are both greater than originally.
D) point M shows the new equilibrium position.
Correct Answer:

Verified
Correct Answer:
Verified
Q256: A demand curve<br>A) shows the relationship between
Q257: Which of the following would not shift
Q258: An increase in the price of digital
Q259: What combination of changes would most likely
Q260: If producers obtain higher prices than before
Q262: In moving along a supply curve, which
Q263: A higher price reduces the quantity demanded
Q264: <span class="ql-formula" data-value="\begin{array} { | c |
Q265: In order to derive the market supply
Q266: By an "increase in demand," economists mean