Multiple Choice
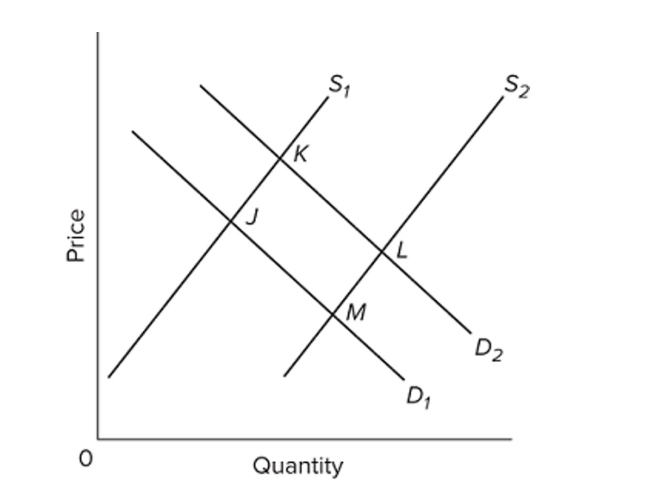 Refer to the diagram, in which S1 and D1 represent the original supply and demand curves and S2 and D2 the new curves. In this market the indicated shift in supply may have been caused by
A) an increase in the wages paid to workers producing this good.
B) the development of more efficient machinery for producing this commodity.
C) this product becoming less fashionable.
D) an increase in consumer incomes.
Correct Answer:

Verified
Correct Answer:
Verified
Q95: <span class="ql-formula" data-value="\begin{array} { | c |
Q96: A and B are substitute goods, but
Q97: <span class="ql-formula" data-value="\begin{array} { | c |
Q98: Suppose product X is an input in
Q99: Given a downsloping demand curve and an
Q101: Productive efficiency refers to<br>A) the use of
Q102: <img src="https://d2lvgg3v3hfg70.cloudfront.net/TB8601/.jpg" alt=" Refer to the
Q103: Which of the following will cause a
Q104: If the price of Pepsi decreases, other
Q105: <span class="ql-formula" data-value="\begin{array} { | c |