Multiple Choice
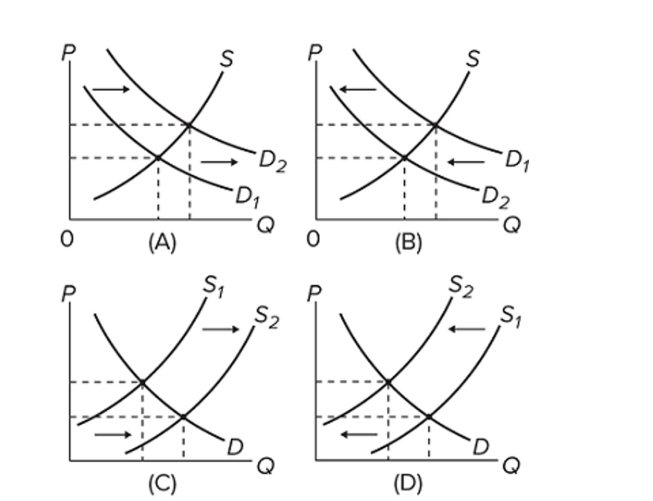 Which of the diagrams illustrate(s) the effect of a decrease in incomes on the market for second- hand clothing?
A) A and C
B) A only
C) B only
D) C only
Correct Answer:

Verified
Correct Answer:
Verified
Related Questions
Q333: (Consider This) Suppose that coffee growers sell
Q334: If there is a surplus of a
Q335: A headline reads, "Lumber Prices Up Sharply."
Q336: An increase in product price will cause<br>A)
Q337: (Last Word) According to recent research, which
Q339: Markets, viewed from the perspective of the
Q340: At the current price, there is a
Q341: An increase in quantity supplied might be
Q342: If the price of product L increases,
Q343: <span class="ql-formula" data-value="\begin{array} { | c |