Multiple Choice
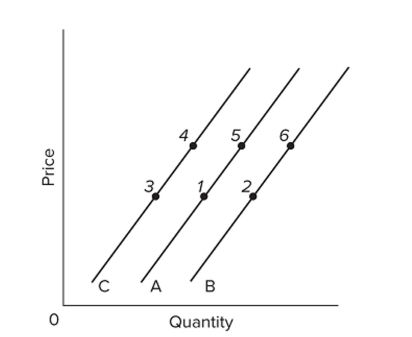 Refer to the above graph. A decrease in supply would best be reflected by a change from
A) point 2 to point 1.
B) point 5 to point 1.
C) point 5 to point 2.
D) point 3 to point 6.
Correct Answer:

Verified
Correct Answer:
Verified
Related Questions
Q292: The construction of demand and supply curves
Q293: Assume in a competitive market that price
Q294: In the past few years, the demand
Q295: A decrease in the price of digital
Q296: Which of the following goods would most
Q298: <img src="https://d2lvgg3v3hfg70.cloudfront.net/TB8601/.jpg" alt=" Refer to the
Q299: Which of the following factors will decrease
Q300: The supply curve shows the relationship between<br>A)
Q301: A decrease in supply of X increases
Q302: Assume that the graphs show a competitive