Multiple Choice
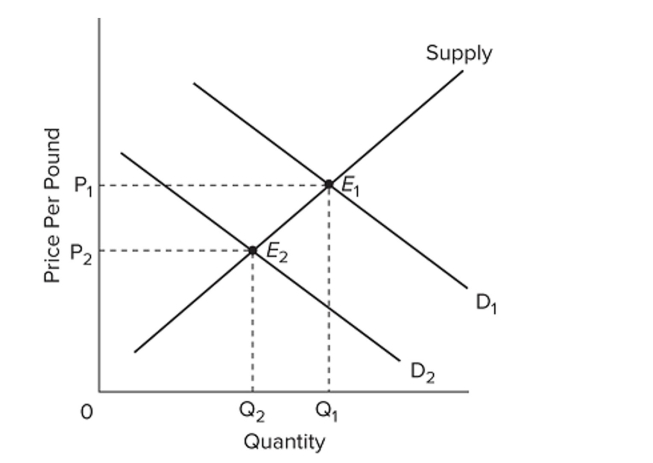 Refer to the above graph, which shows the market for beef where demand shifted from D1 to D2. The change in equilibrium from E1 to E2 is most likely to result from
A) a decrease in consumer incomes.
B) an increase in the cost of cattle feed.
C) an increase in the price of pork.
D) a decrease in the tax on beef products.
Correct Answer:

Verified
Correct Answer:
Verified
Q285: Graphically, the market demand curve is<br>A) steeper
Q286: Which would be a likely cause of
Q287: Digital cameras and memory cards are<br>A) substitute
Q288: <img src="https://d2lvgg3v3hfg70.cloudfront.net/TB8601/.jpg" alt=" Refer to the
Q289: If market demand increases and market supply
Q291: <span class="ql-formula" data-value="\begin{array} { | c |
Q292: The construction of demand and supply curves
Q293: Assume in a competitive market that price
Q294: In the past few years, the demand
Q295: A decrease in the price of digital