Multiple Choice
Assume that the graphs show a competitive market for the product stated in the question. 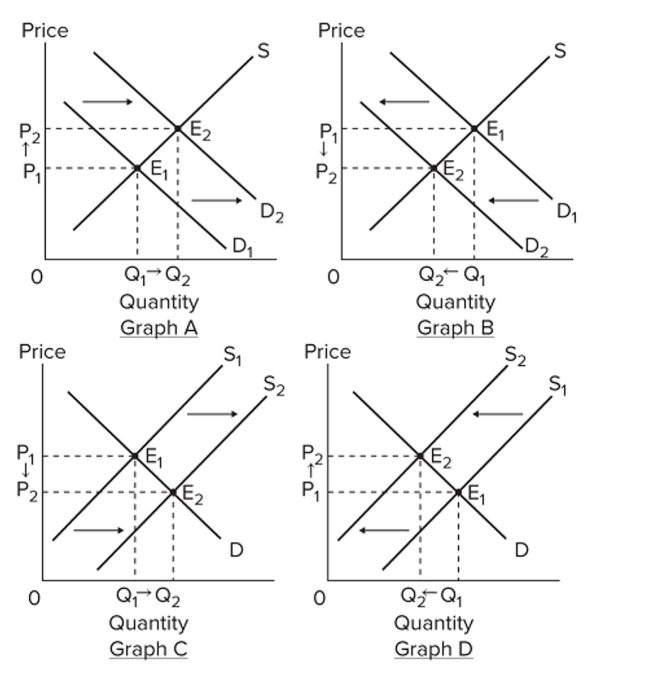 Select the graph above that best shows the change in the market specified in the following
Situation: the market for houses, when consumers experience a substantial fall in income due to a
Serious economic recession.
A) Graph A
B) Graph B
C) Graph C
D) Graph D
Correct Answer:

Verified
Correct Answer:
Verified
Q137: When economists speak of "demand" in a
Q138: <img src="https://d2lvgg3v3hfg70.cloudfront.net/TB8601/.jpg" alt=" Refer to the
Q139: Suppose that corn prices rise significantly. If
Q140: In order to derive a market demand
Q141: <span class="ql-formula" data-value="\begin{array} { | c |
Q143: Which of the following will not cause
Q144: "Price" in the statement of the Law
Q145: <img src="https://d2lvgg3v3hfg70.cloudfront.net/TB8601/.jpg" alt=" Refer to the
Q146: <span class="ql-formula" data-value="\begin{array} { | c |
Q147: <img src="https://d2lvgg3v3hfg70.cloudfront.net/TB8601/.jpg" alt=" In a competitive