Multiple Choice
In the diagrams below, the subscript "1" refers to the initial position of the curve, while the subscript "2" refers to the final position after the curve shifts.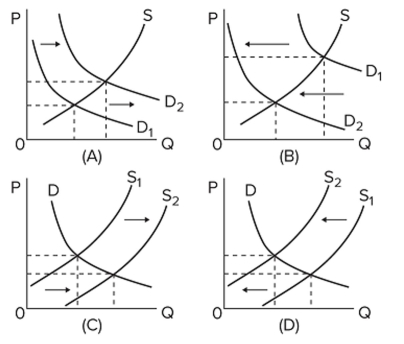 Which diagram illustrates the effects on the peanut butter market, if severe flooding destroys a large
Portion of the peanut crop in the economy?
A) A
B) B
C) C
D) D
Correct Answer:

Verified
Correct Answer:
Verified
Q263: A higher price reduces the quantity demanded
Q264: <span class="ql-formula" data-value="\begin{array} { | c |
Q265: In order to derive the market supply
Q266: By an "increase in demand," economists mean
Q267: An increase in the price of product
Q269: In moving along a demand curve, which
Q270: Toothpaste and toothbrushes are substitute goods.
Q271: <img src="https://d2lvgg3v3hfg70.cloudfront.net/TB8601/.jpg" alt=" Refer to the
Q272: (Advanced analysis) The equation for the demand
Q273: Over time, the equilibrium price of a