Multiple Choice
The diagrams represent various states of abnormal hydration. In each diagram, the normal state (solid lines) is superimposed on the abnormal state (dashed lines) to illustrate the shifts in the volumes (width of rectangles) and total osmolarities (height of rectangles) of the extracellular fluid and intracellular fluid compartments.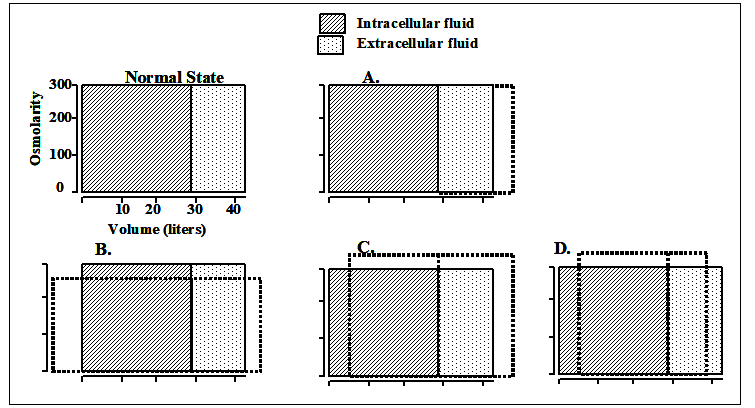
-Which of the diagrams represents the changes (after osmotic equilibrium) in extracellular and intracellular fluid volumes and osmolarities after infusion of a 2% solution of glucose (molecular weight of glucose = 180 g/mol) ?
A) A
B) B
C) C
D) D
Correct Answer:

Verified
Correct Answer:
Verified
Q20: A 22-year-old female patient complaining of headaches
Q21: You need to evaluate kidney function in
Q22: Following Questions : Choose the appropriate
Q23: A patient treated chronically with a carbonic
Q24: Which set of changes would you expect
Q26: What is the net renal tubular reabsorption
Q27: Compared with normal conditions, which one of
Q28: Which of the following substances would be
Q29: Which of the following changes would tend
Q30: Which of the following statements is correct?<br>A)Urea