Multiple Choice
The diagrams represent various states of abnormal hydration. In each diagram, the normal state (solid lines) is superimposed on the abnormal state (dashed lines) to illustrate the shifts in the volumes (width of rectangles) and total osmolarities (height of rectangles) of the extracellular fluid and intracellular fluid compartments.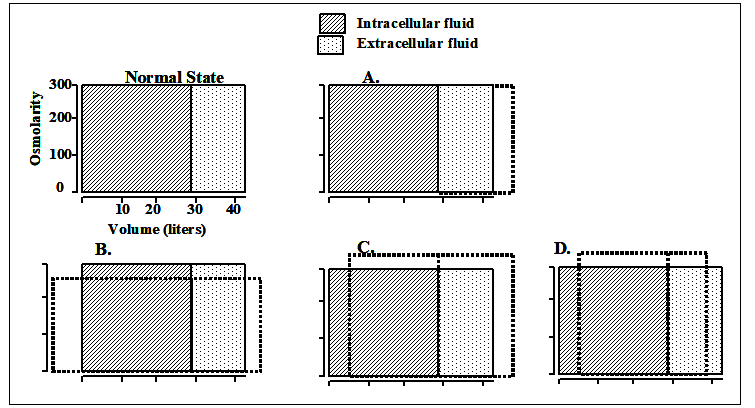
-Which of the diagrams would represent the changes (after osmotic equilibrium) in extracellular and intracellular fluid volumes and osmolarities after infusion of 3.0% sodium chloride (molecular weight of dextrose = 58.5 g/mol) ?
A) A
B) B
C) C
D) D
Correct Answer:

Verified
Correct Answer:
Verified
Q29: Which of the following changes would tend
Q30: Which of the following statements is correct?<br>A)Urea
Q31: Which of the following is true
Q32: Long-term administration of furosemide would:<br>A. Inhibit
Q33: The clinical laboratory returns the following arterial
Q35: A 26-year-old woman reports that she has
Q36: A healthy 24-year-old woman runs a 10k
Q37: A 55-year-old woman reports recent rapid weight
Q38: Which set of changes, compared with normal,
Q39: In a patient with chronic excess aldosterone