Multiple Choice
Solve the problem.
-An accountant tabulated a firm's profits for four recent years in the following table:
The accountant then fit both a linear graph and an exponential curve (seen below) to the data, in order to estimat profits. Use the exponential graph to estimate the profits in the year 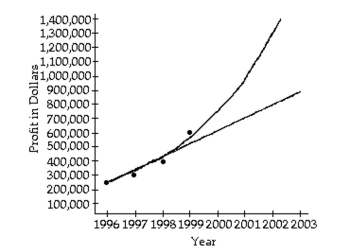
A) About
B) About
C) About
D) About
Correct Answer:

Verified
Correct Answer:
Verified
Q4: Graph.<br>- <span class="ql-formula" data-value="x=\left(\frac{1}{4}\right)^{y}"><span class="katex"><span class="katex-mathml"><math
Q5: Find the requested composition of functions.<br>-Given
Q6: Graph.<br>- <span class="ql-formula" data-value="f ( x
Q7: Graph.<br>- <span class="ql-formula" data-value="f(x)=2^{-x}"><span class="katex"><span class="katex-mathml"><math
Q8: Determine whether the function is one-to-one.<br>-
Q10: Solve the problem.<br>-The number of dislocated
Q11: Graph.<br>- <span class="ql-formula" data-value="f(x)=4^{x}"><span class="katex"><span class="katex-mathml"><math
Q12: Determine whether the given function is
Q13: Determine whether the function is one-to-one.<br>-
Q14: Determine whether the function is one-to-one.<br>-