Multiple Choice
The graph shows the depth of water W in a reservoir over a one-year period as a function of the number of days x since the beginning of the year. Estimate the average rate of change of W between x = 0 and x= 100? 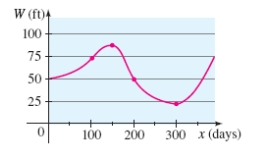
A)
B)
C)
D)
E) none of these
Correct Answer:

Verified
Correct Answer:
Verified
Related Questions
Q49: A function is given. (a) Find
Q50: Use a graphing calculator to find,
Q51: Given <span class="ql-formula" data-value="f (
Q52: Find the domain of the function.
Q53: Find the domain of the function.
Q55: If an object is dropped from
Q56: <span class="ql-formula" data-value="\text { If } f
Q57: Sketch the graph of the function.
Q58: Sketch the graph of the function.
Q59: Describe how the graph of