Multiple Choice
The graph shows the depth of water W in a reservoir over a one-year period as a function of the number of days x since the beginning of the year. Estimate the average rate of change of W between x = 0 and x= 100?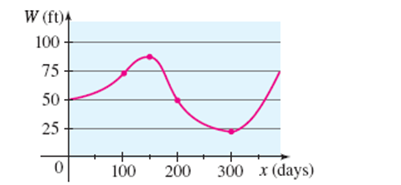
A)
B)
C)
D)
E) none of these
Correct Answer:

Verified
Correct Answer:
Verified
Q24: <span class="ql-formula" data-value="\text { Evaluate } f
Q25: Determine which functions are one-to-one.<br>I <img src="https://d2lvgg3v3hfg70.cloudfront.net/TB8630/.jpg"
Q26: Evaluate <span class="ql-formula" data-value="f (
Q27: Determine if the equation <span
Q28: Given <span class="ql-formula" data-value="f (
Q30: A function f is given, and
Q31: For the function given, find
Q32: Use a graphing device to draw
Q33: Find the domain of the function.
Q34: Determine whether the curve represents a graph