Essay
The graph gives the number of farms in the United States from 1850 to 2000.Estimate the average rate of change in the number of farms between the following years.
(i) 1860 and 1890
(ii) 1920 and 1980 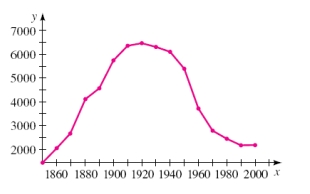
Correct Answer:

Verified
Correct Answer:
Verified
Related Questions
Q106: If <span class="ql-formula" data-value="f (
Q107: A function f is given, and
Q108: Determine if the equation <span
Q109: Determine whether or not the function
Q110: For the function <span class="ql-formula"
Q112: Use a graphing dervice to draw
Q113: The graph of a function
Q114: Describe how the graph of
Q115: Determine which viewing rectangle produces the
Q116: Use <span class="ql-formula" data-value="f (