Multiple Choice
Figure 4
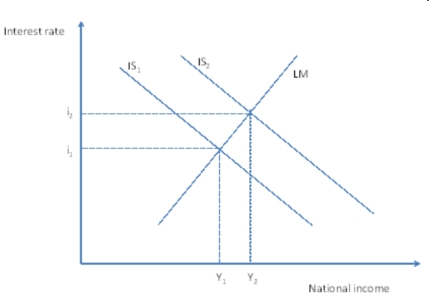
-Refer to Figure 4 above.What could have caused the shift in the IS curve shown?
A) An increase in money supply.
B) A decrease in money supply.
C) A rise in tax.
D) A reduction in tax.
Correct Answer:

Verified
Correct Answer:
Verified
Related Questions
Q3: If the economy was in equilibrium where
Q10: Which of the following statements about the
Q13: IS stands for:<br>A) Investment and Spending<br>B) Imports
Q26: Which of the following statements about the
Q42: In the Keynesian cross diagram the 45
Q44: One of the main sources of disagreement
Q47: Refer to Figure 3 below.Which statement about
Q47: The IS curve measures points where the
Q51: The government increases spending by R10 billion
Q53: On a Keynesian cross diagram, the 45