Multiple Choice
Figure 1.
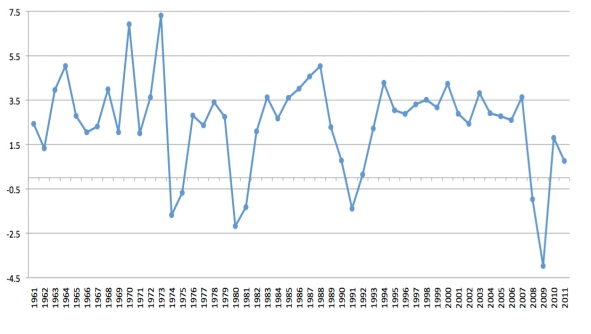
-Referring to Figure 1, the number of recessions shown in the time series was:
A) 4
B) 9
C) 13
D) 15
Correct Answer:

Verified
Correct Answer:
Verified
Related Questions
Q11: Which consumer purchases are more volatile over
Q13: Which of the following statements is true?<br>A)
Q15: The amplitude measures the difference between start
Q20: What is meant by a leading indicator?
Q21: A recession occurs<br>A)when economic growth declines.<br>B)when there
Q22: Economic forecasting is not perfect,<br>A)so this means
Q29: Figure 1.<br> <img src="https://d2lvgg3v3hfg70.cloudfront.net/TB8816/.jpg" alt="Figure 1.
Q38: Which is an external source affecting the
Q45: In what way does the real business
Q55: Which aggregate supply shock is most likely