Multiple Choice
The figure given below depicts the demand and supply of Brazilian reals in the foreign exchange market. Assume that the market operates under a flexible exchange rate regime.
Figure 21.1
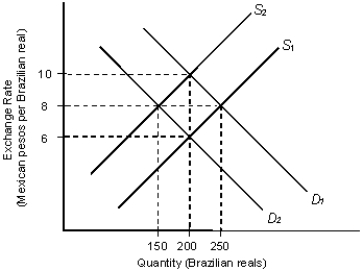
In the figure:
D1 and D2: Demand for Brazilian reals
S1 and S2: Supply of Brazilian reals
-Refer to Figure 21.1. Determine the equilibrium exchange rate and equilibrium quantity of Brazilian reals, if D1 and S1 are the relevant demand and supply curves for Brazilian reals in this market.
A) 10 pesos per real and a quantity of 150 reals
B) 6 pesos per real and a quantity of 250 reals
C) 8 pesos per real and a quantity of 150 reals
D) 8 pesos per real and a quantity of 250 reals
E) 6 pesos per real and a quantity of 200 reals
Correct Answer:

Verified
Correct Answer:
Verified
Q6: The figure below shows the demand (D)
Q15: The figure given below depicts the foreign
Q28: The figure given below depicts the foreign
Q39: The figure below shows the demand (D)
Q47: Equilibrium in the foreign exchange market occurs:<br>A)at
Q63: Fixed exchange rates allow countries to formulate
Q65: The figure given below depicts the foreign
Q117: The figure given below depicts the foreign
Q118: The figure below shows the demand (D)
Q125: The figure given below depicts the foreign