Multiple Choice
The figure given below represents the new classical long run and short run Phillips curve measuring inflation rate on vertical axis and unemployment rate on horizontal axis.
Figure 15.2
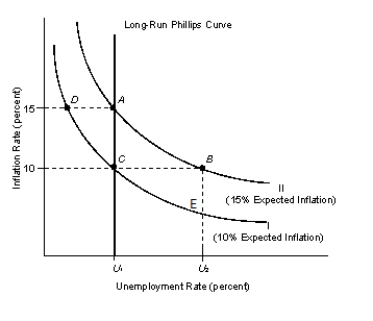
-Refer to Figure 15.2. Assume that the economy is now at point B. If government officials announce and carry out a policy that will maintain the inflation rate at 15 percent, we would expect:
A) the economy to move to point A.
B) the economy to remain at point B.
C) the economy to move to point C.
D) the economy to move to point D.
E) the economy to move to point E.
Correct Answer:

Verified
Correct Answer:
Verified
Q6: According to classical economics:<br>A)real GDP is determined
Q26: The time it takes for a particular
Q33: In traditional Keynesian economics:<br>A)the aggregate supply curve
Q34: If the traditional Keynesian views turn out
Q44: Milton Friedman is widely considered to be
Q52: The assumption of wage and price flexibility
Q60: Monetarists argue that government actions, particularly monetary
Q71: Monetarists believe that in the short run:<br>A)the
Q80: The main reason why the traditional classical
Q86: In the early 1960s, monetary theory rather