Multiple Choice
The figure given below represents the short run and long run Phillips curve.
Figure 14.4
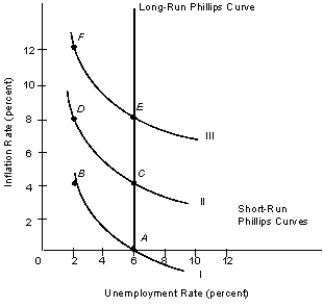
-Refer to Figure 14.4. If the adaptive expectations hypothesis holds, and the economy moves from point C to point D because of expansionary fiscal policy, what rate of inflation are people expecting at point D?
A) 2 percent
B) 4 percent
C) 6 percent
D) 8 percent
E) 10 percent
Correct Answer:

Verified
Correct Answer:
Verified
Q9: The long-run Phillips curve corresponds to the
Q22: Suppose the inflation rate has risen 0.5
Q26: The figure given below represents the short
Q26: Identify the correct statement.<br>A)The removal of financial
Q57: When the reservation wage is adjusted to
Q60: Suppose the inflation rate has been 6
Q82: If nominal wage rates are contractually determined
Q85: Which of the following is most likely
Q95: Worldwide statistics prove that, when economies experience
Q105: When workers expect more inflation than actually