Multiple Choice
The figure given below shows the consumption function of a household.
Figure 9.2
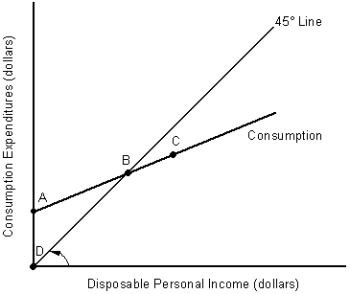
-In Figure 9.2, consumption equals disposable income:
A) at point A only.
B) at point B only.
C) at point C only.
D) at points A and C only.
E) at all points on the consumption function.
Correct Answer:

Verified
Correct Answer:
Verified
Q6: As disposable income rises:<br>A)consumption falls as a
Q43: A key assumption of the Keynesian model
Q64: Other things equal, an increase in the
Q83: The figure given below represents the consumption
Q84: The figure given below represents the saving
Q87: As capacity utilization in an economy rises:<br>A)firms
Q91: Any increase in autonomous consumption is associated
Q111: The net export function illustrates that:<br>A)net exports
Q113: If capacity utilization by businesses remains constant,
Q115: If a household experiences a $880 increase